Chart visualization
| This page describes the 'catkinized' version of KnowRob that uses the catkin buildsystem and the pure Java-based rosjava. The older version, which was based on the rosbuild buildsystem and rosjava_jni, used a local visualization canvas implemented in Java. |
|---|
The chart visualization client listens to a given ROS topic for data_vis_msgs and displays them as a chart. Currently, donut charts and bar charts are supported.
Creating charts from KnowRob
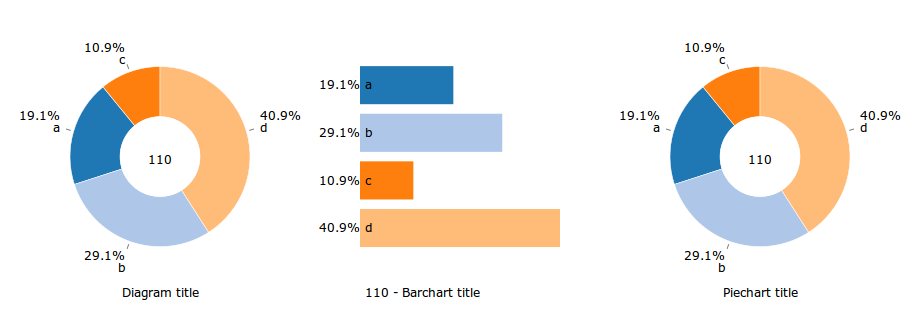
The following predicates start the publisher that sends updates to the diagram canvas and create a new diagram with the given values. The add_diagram predicate is the most generic one that gives full control over all parameters. In contrast, the add_piechart and add_barchart predicates have fewer parameters and use default values for e.g. the size of the diagrams.
$ rosrun rosprolog rosprolog knowrob_vis
?- diagram_canvas.

% Long version:
?- add_diagram(diagram_id,
              'Diagram title',
               piechart,
              'Label for x-axis',
              'Label for y-axis',
              300, 300, '12px',
              [[[a,b,c,d],['21','32','12','45']]]).

% Shorter versions: default parameters for piecharts and barcharts
?- add_piechart(piechart_id, 'Piechart title', [[[a,b,c,d],['21','32','12','45']]]).
?- add_barchart(barchart_id, 'Barchart title', [[[a,b,c,d],['21','32','12','45']]]).
These three queries will create the following charts:
Behind the scenes: Communication via ROS topics
The predicates mentioned above publish messages in the following format on the topic data_vis_msgs. This topic is forwarded via a websocket by the rosbridge server, and a roslibjs listener included in the web page receives and visualizes the messages.
  id: id
  type: 0
  title: title
  xlabel: xlabel
  ylabel: ylabel
  width: 210
  height: 210
  fontsize: 12px
  values:
    -
      value1: ['a', 'b']
      value2: ['1', '2']
    -
      value1: ['a', 'b']
      value2: ['1', '2']
Type 0 means donut chart, type 1 is a bar chart. To update data in an already existing diagram, simply publish the message again with the same id and new data in value1 and value2. The chart will update immediately. To remove a chart, publish a message with its id and an empty array for value2. By now, only the first element of the 'values'-array is used (it has been made an array to support other kinds of diagrams in the future, for example multiple timelines).
For testing purposes, messages can be published to the topic using the rostopic tool
$ rostopic pub /data_vis_msgs data_vis_msgs/DataVis '
  {
    id: "arbitrary_id_string",
    type: 0,
    title: "some title",
    xlabel: "x",
    ylabel: "y",
    width: 300,
    height: 300,
    fontsize: '14px',
    values: [{
      value1: ["a","b","c"],
      value2: ["3","8","5"]
    }]
  }
'
Visualization in the browser
This simple web site subscribes to the topic 'data_vis_msgs' and adds diagrams to the div 'chart'.
<!DOCTYPE html>
<head>
  <meta charset="utf-8">

  <script type="text/javascript" src="http://cdn.robotwebtools.org/EventEmitter2/current/eventemitter2.min.js"></script>
  <script type="text/javascript" src="http://cdn.robotwebtools.org/ColladaAnimationCompress/current/ColladaLoader2.min.js"></script>
  <script type="text/javascript" src="http://cdn.robotwebtools.org/roslibjs/current/roslib.min.js"></script>
  <script type="text/javascript" src="DonutChart.js"></script>
  <script type="text/javascript" src="BarChart.js"></script>
  <script type="text/javascript" src="DataVisClient.js"></script>
  <script src="http://d3js.org/d3.v3.min.js"></script>

  <script type="text/javascript" type="text/javascript">
    function init() {

      var ros = new ROSLIB.Ros({
        url : 'ws://localhost:9090'
      });

      var options = {
        ros: ros,
        containerId: '#chart',
        topic: 'data_vis_msgs'
      };
      var dataVisClient = new DataVisClient(options);
    }
  </script>
</head>
<style>
</style>

<body onload="init()">

<div id="top">
<h1>DataVis Demo</h1>
<div id="chart">

</div>
</div>
</body>
Make sure DonutChart.js, BarChart.js and DataVisClient.js are located in the same directory as the html file and you run
$ roslaunch knowrob_vis knowrob_vis.launch
on your localhost. Now you can publish messages using prolog queries or the rostopic tool and watch the corresponding diagram appear.
