Table of Contents
Flow chart visualization
Note: This page describes experimental code that has not been used in a while. Please try it at your own risk.
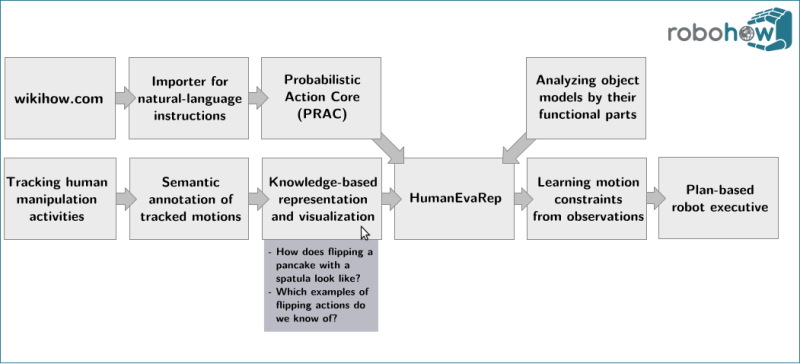
The flow chart visualizer allows to load SVG files and to define actions that are to be taken when the user clicks on the elements in the graphics. It is designed as a convenient way of showing processing pipelines and calling processing steps. All rectangular shapes can be turned into click-sensitive areas by defining (in a .yaml file accompanying the .svg) which action is to be taken when the user clicks on the respective element.
Installation
The code is part of the knowrob_addons stack and can be found in the following repository:
git clone https://github.com/knowrob/knowrob_addons.git
rosmake flowchart_vis
rosrun flowchart_vis flowchart_vis /path/to/img.svg
Requirements on the SVG files
The SVG files need to be created in a special way for the system to work:
- All blocks that are to be used for interaction need to have special identifiers which can be set by right clicking on the element → Object properties.
- There are two kinds of blocks: Elements of the processing pipeline and context menus for these elements. The former need to have identifiers of the form “block_<id>”, the corresponding menu blocks have the form owl#drawer_island_middle_lower, the text in the menu blocks has the form “text_<id>_menu”.
- There has to be a background rectangle called “background” that has its origin in the upper left corner of the image.
- Text must be converted into paths (Object → To path)
Definition of interactions
The actions to be performed when an element has been clicked are defined in a yaml file that must be in the same folder as the svg and have the same filename (apart from the extension…). Three kinds of interaction are supported:
- Executing Java methods: Static Java methods can be specified using IRIs of the form java://<namespace+class>#<method>()
- Querying the KnowRob knowledge base: Prolog queries are described by 'prolog://<query>'
- Calling ROS services: ROS services can be called by service://<node>/<service-name>#<type>&<argument>'. Since rosjava has limited support for introspection (which could be used to read the service types and message formats), the logic for calling the service needs to be implemented in the Java file.
The following example of a YAML file defines three actions for the IDs prac, importer and tracking. As mentioned earlier, the corresponding blocks are called block_<id>.
actiondefs:
  prac     : 'java://org.prac.main.PracInfer#doStuff()'
  importer : 'prolog://query(a, B, C), a2(C)'
  tracking : 'service://hand_tracking/start#hand_tracking.srv.StartTracker&startTracking'
