Web-based visualization tools
| This page describes the 'catkinized' version of KnowRob that uses the catkin buildsystem and the pure Java-based rosjava. The older version, which was based on the rosbuild buildsystem and rosjava_jni, used a local visualization canvas implemented in Java. |
|---|
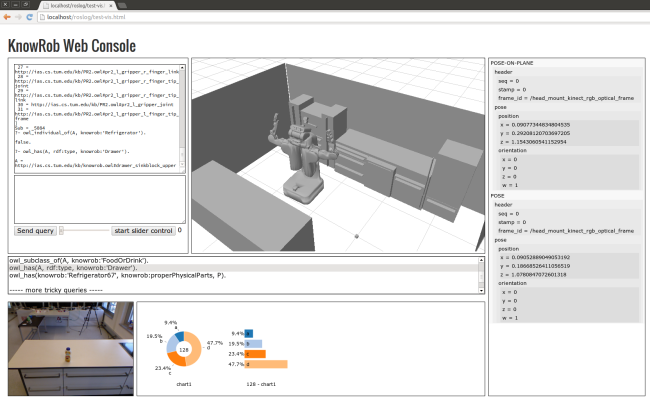
KnowRob comes with a range of web-based visualization tools for different kinds of information. All of these tools are accessible from within the knowledge base via Prolog predicates that send the data to the user's browser. When launching the KnowRob visualization canvas, a Web server is automatically started that serves the HTML pages and JavaScript files for this interface. It can be reached at http://localhost:1111. The default page only contains the 3D canvas; a more complete page with all the visualization modules below can be found at http://localhost:1111/robohow.html. Please note that the available functionality depends on the packages that are loaded. All web-based tools require a running rosbridge instance:
roslaunch rosbridge_server rosbridge_websocket.launch

Marker-based 3D visualization canvas
The block in the upper center is a 3D visualization canvas similar to the rviz visualization tool in ROS. Other than rviz, it it not used to visualize the current state of the robot, but to display the results of KnowRob queries that may involve the world state at other points in time. More information on this canvas can be found here.
Prolog query console & query library
The block in the upper left is a Prolog console that interacts with a KnowRob instance via the json_prolog service. You can send queries as you would send via the terminal by pasting them into the lower field; the upper one contains a history and query results. The queries can contain predicates that, as side-effect, update the other visualization windows. For demonstration purposes, there is a library of prepared queries that can be inserted into the query window by clicking on the entries in the 'library' block. They can then be adapted and sent to KnowRob as any other query. The query console requires the json_prolog service to be available, i.e. you need to start KnowRob using roslaunch instead of rosrun.
Chart visualization
This area can accommodate a set of charts that visualize statistical data. They are filled by messages published on the 'data_vis_msgs' topic. More information on the use of this visualization can be found here.
Designator visualization
The designator visualization block displays the nested structure of designators as indented grey boxes. Designators are the main datastructure of the CRAM executive. The visualization listens to the /logged_designators topic and always displays the latest designator message received. The code for this visualization can be found in the knowrob_cram package.
Image canvas
The canvas in the lower right displays images whose URL is sent as ROS messages via the /logged_images topic. When logging data during plan execution, the PR2 regularly takes snapshots of its camera image at important points in time and save them via this topic, so they will automatically be updated when a plan is executed. To use this canvas for your queries, you need to make sure that the images can be accessed either via a file: or http: URL, and publish the URL of the image as message on the given topic.

